

Data from 45 countries show containing COVID vs saving the economy is a false dichotomy
- Written by Michael Smithson, Professor, Australian National University
There is no doubt the COVID-19 crisis has incurred widespread economic costs. There is understandable concern that stronger measures against the virus, from social distancing to full lockdowns, worsen its impact on economies.
As a result, there has been a tendency to consider the problem as a trade-off between health and economic costs.
This view, for example, has largely defined the approach of the US federal government. “I think we’ve learned that if you shut down the economy, you’re going to create more damage,” said US Treasury Secretary Steve Mnuchin in June, as the Trump administration resisted calls to decisively combat the nation’s second COVID wave.
But the notion of a trade-off is not supported by data from countries around the world. If anything, the opposite may be true.
Data from 45 nations
Let’s examine available data for 45 nations from the Organisation for Economic Co-operation and Development, using COVID-19 data and economic indicators.
The COVID-19 statistics we’ll focus on are deaths per million of population. No single indicator is perfect, and these rates don’t always reflect contextual factors that apply to specific countries, but this indicator allows us to draw a reasonably accurate global picture.
The economic indicators we’ll examine are among those most widely used for overall evaluations of national economic performance. Gross domestic product (GDP) per capita is an index of national wealth. Exports and imports measure a country’s international economic activity. Private consumption expenditure is an indicator of how an economy is travelling.
Effects on GDP per capita
Our first chart plots nations’ deaths per million from COVID-19 against the percentage change in per capita GDP during the second quarter of 2020.
The size of each data point shows the scale of deaths per million as of June 30, using a logarithmic, or “log”, scale – a way to display a very wide range of values in compact graphical form.
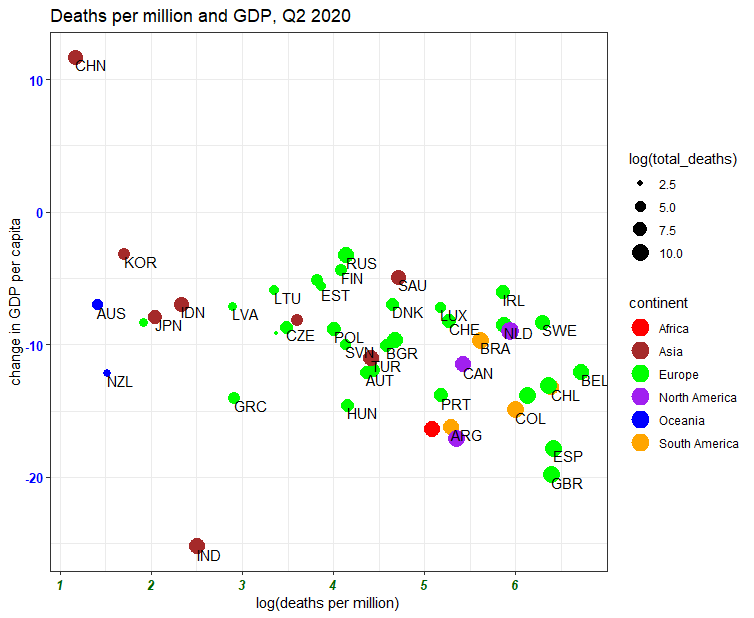 Log(deaths per million) by percentage change in Q2 2020 GDP per capita.
If suppressing the virus, thereby leading to fewer deaths per million, resulted in worse national economic downturns, then the “slope” in figure 1 would be positive. But the opposite is true, with the overall correlation being -0.412.
The two outliers are China, in the upper-left corner, with a positive change in GDP per capita, and India at the bottom. China imposed successful hard lockdowns and containment procedures that meant economic effects were limited. India imposed an early hard lockdown but its measures since have been far less effective. Removing both from our data leaves a correlation of -0.464.
Exports and imports
Our second chart shows the relationship between deaths per million and percentage change in exports.
If there was a clear trade-off between containing the virus and enabling international trade, we would see a positive relationship between the changes in exports and death-rates. Instead, there appears to be no relationship.
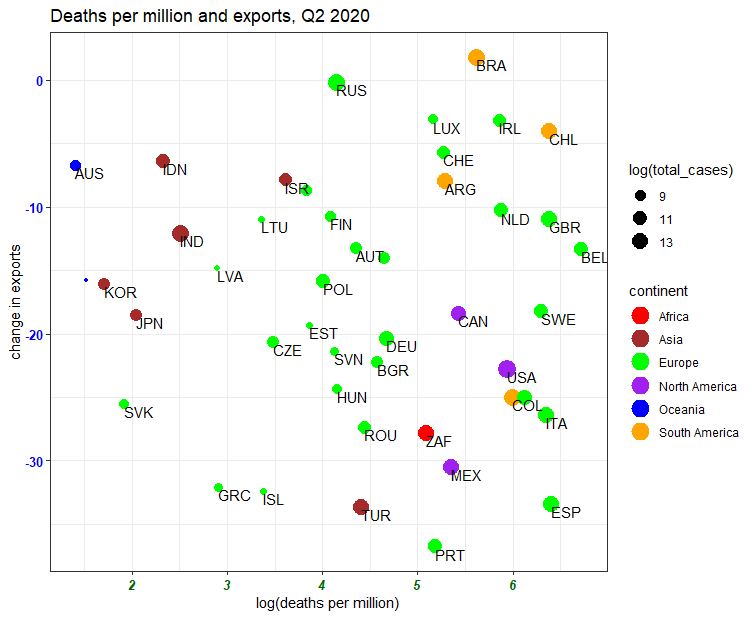 Log(deaths per million) by percentage change in Q2 2020 exports.
Our third chart shows the relationship between deaths per million and percentage change in imports. As with exports, a trade-off would show in a positive relationship. But there is no evidence of such a relationship here either.
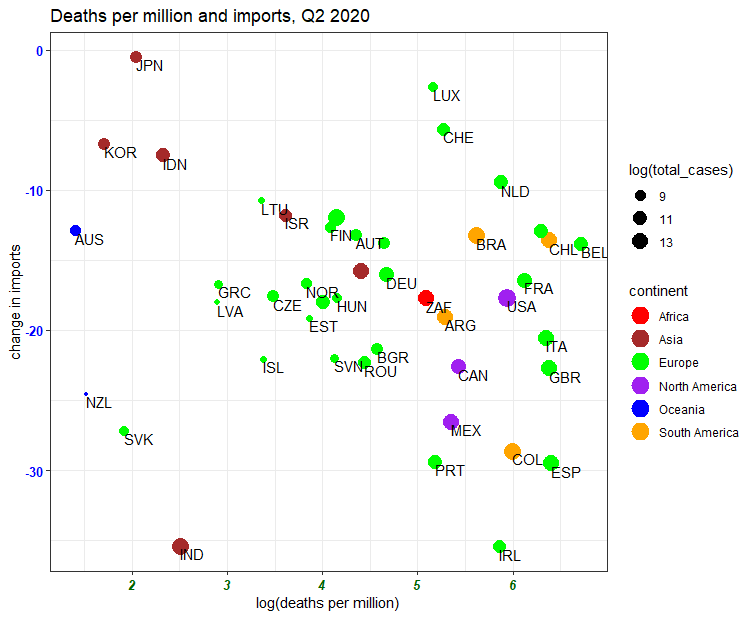 Log(deaths per million) by percentage change in Q2 2020 imports.
Consumer spending
Our fourth chart shows the relationship between deaths per million and percentage change in private consumption expenditure. This complements the picture we get from imports and exports, by tracking consumer spending as an indicator of internal economic activity.
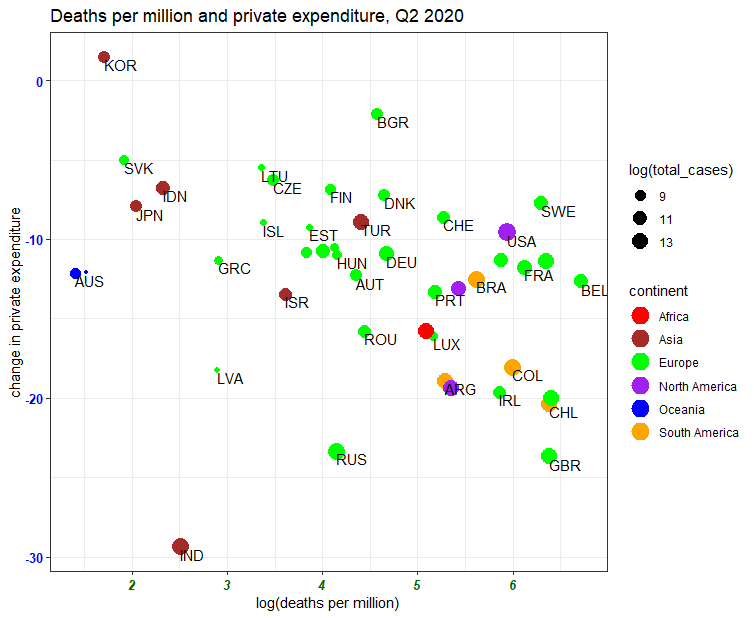 Log(deaths per million) by percentage change in Q2 2020 private consumption.
Again, no positive relationship. Instead, the overall negative relationship suggests those countries that succeeded (at least temporarily) in suppressing the virus were better off economically than those countries adopting a more laissez-faire approach.
National wealth
As a postscript to this brief investigation, let’s take a quick look at whether greater national wealth seems to have helped countries deal with the virus.
Our fifth and final chart plots cases per million (not deaths per million) against national GDP per capita.
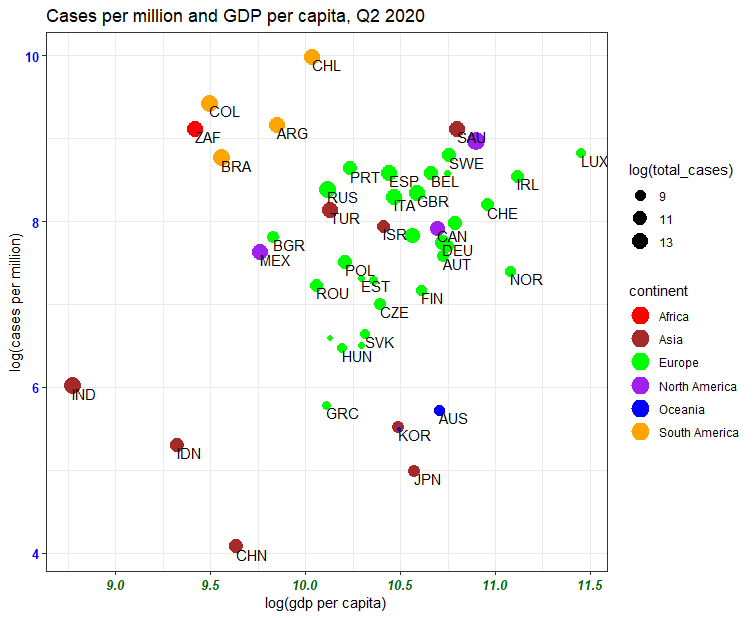 Log(GDP per capita) by log(cases per million).
If wealthier countries were doing better at suppressing transmission, the relationship should be negative. Instead, the clusters by region suggest it’s a combination of culture and politics driving the effectiveness of nations’ responses (or lack thereof).
In fact, if we examine the largest cluster, of European countries (the green dots), the relationship between GDP per capita and case rates is positive (0.379) – the opposite of what we would expect.
Read more: Vital Signs: the cost of lockdowns is nowhere near as big as we have been told
It’s not a zero-sum game
The standard economic indicators reviewed here show, overall, countries that have contained the virus also tend to have had less severe economic impacts than those that haven’t.
No one should be misled into believing there is zero-sum choice between saving lives and saving the economy. That is a false dichotomy.
If there is anything to be learned regarding how to deal with future pandemics, it is that rapidly containing the pandemic may well lessen its economic impact.